


Verification

-
![]() Traditional Electric HeatingRead the study
Traditional Electric HeatingRead the studyBoilers and dry heating systems using electricity in Guernsey produce over 70% less carbon than oil heating and over 60% less than gas (LPG). This takes into account the entire lifecycle of each heating type, and for electricity this also includes electricity generated using diesel generators at the Vale power station.
-
![]() Off-Peak Storage HeatingRead the study
Off-Peak Storage HeatingRead the studyAn storage heater banks imported, low-carbon electricity overnight during low-rate timebands and significantly reduces localised carbon emissions. This Off-Peak Heating produces over 85% less in carbon emissions than electric boilers, and over 94% less emissions than gas and oil heating. Off-Peak Heating works like a battery and means you can store heat energy during low-cost, low-carbon periods to use later in the day at 'peak' times.
-
![]() Air Source Heat PumpsRead the study
Air Source Heat PumpsRead the studyAir source heat pumps are one of the cheapest and cleanest ways to heat a home due to their high efficiency. Provided the property is well insulated, they can produce around 90% less carbon emissions than oil or gas heating, and nearly 70% less than an electric boiler. This refers to the entire lifecycle of each heating type, and for electric heating this includes power generated using heavy fuel oil at the Vale power station.
-
![]() Electric vehiclesRead the study
Electric vehiclesRead the studyIn Guernsey, charge an EV between 11pm and 5am and you'll produce over 70% less carbon emissions than driving a petrol vehicle, and over 60% less than diesel. These figures are calculated across the vehicle's entire lifecycle and using our low-carbon, import-only electricity together with production of the lithium-ion battery and final disposal. EV Charging during 'peak' daytime hours will increase your EV's emissions as it includes fossil-fuel generation at the power station, but emissions will still be considerably less than an internal combustion engine (ICE) vehicle.
-
![]() Appliance Carbon EmissionsRead the study
Appliance Carbon EmissionsRead the studyIt's all about timing. By running household items such as hot water cylinders and electrical appliances between 11pm and 5am, you could reduce your appliance carbon emissions by around 90%. This is because during quiet periods on the grid, we can rely 100% on our imported low-carbon electricity which means a significant reduction in your carbon footprint simply by changing when you run certain appliances such as hot water cylinders, washing machines, dishwashers and tumble dryers.
-
![]() Power station peak timesRead More
Power station peak timesRead MoreThe best time to use electricity in Guernsey is between 11pm and 5am. During this period, demand is low and heavy fuel oil at the power station is not needed to top up your electricity demand. When islander's demand exceeds the 60MW renewable importation capacity, Guernsey Electricity will need to use fossil-fuel generators at the power station. Then when demand exceeds around 70MW, further fossil-fuel generation is needed to meet demand, which means more heavy fuel oil and more localised carbon emissions.


We do our best to make sure our marketing communications are in line with the Competition and Marketing Authority's Green Claims Code. If you believe any of our advertised material does not adhere to the key points mentioned, please let us know.

-
![]() What is the 'GEL Mix'?Electricity in Guernsey is a mix of sources. Annually, this is made up of around 90% imported hydro, wind and solar power, with the rest topped up by on-island community solar power and heavy fuel oil generation from the Vale power station.
What is the 'GEL Mix'?Electricity in Guernsey is a mix of sources. Annually, this is made up of around 90% imported hydro, wind and solar power, with the rest topped up by on-island community solar power and heavy fuel oil generation from the Vale power station. -
![]() Lower-Carbon ElectricityGuernsey imports 60MW of lower-carbon electricity from the European grid and has been the island's most significant contribution to lowering carbon emissions from 1990 levels
Lower-Carbon ElectricityGuernsey imports 60MW of lower-carbon electricity from the European grid and has been the island's most significant contribution to lowering carbon emissions from 1990 levels -
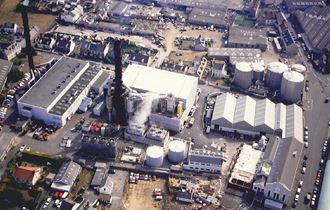
![]() Fossil-Fuel GenerationWhen islander's demand exceeds 60MW, the power station is required to start up a diesel generator to supply the electricity required. At times when demand exceeds 70MW, a second generator start-up is required.
Fossil-Fuel GenerationWhen islander's demand exceeds 60MW, the power station is required to start up a diesel generator to supply the electricity required. At times when demand exceeds 70MW, a second generator start-up is required. -
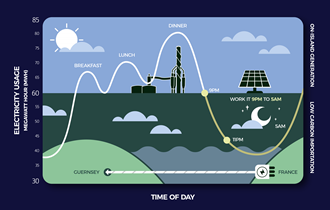
![Guernsey's electricity load profile]() Peak DemandElectricity demand follows human behaviour and peaks at certain times. The common peak times are 8am, 2pm and notably 6pm, when most stress is placed on the power station. During a typical summer, demand remains below 60MW and the power station is not required to top up our electricity demand.
Peak DemandElectricity demand follows human behaviour and peaks at certain times. The common peak times are 8am, 2pm and notably 6pm, when most stress is placed on the power station. During a typical summer, demand remains below 60MW and the power station is not required to top up our electricity demand.

This is short for carbon dioxide equivalent.
CO₂e is a way to describe the overall contribution to global warming when taking into account the carbon dioxide (CO₂) as well as other greenhouse gas emissions, such as methane and nitrous oxide.
Electric Vehicles
-
![]() Cost to driveVehicle cost calculator
Cost to driveVehicle cost calculatorHow much does my vehicle cost to run?
Use our online tool to compare the cost of driving a vehicle in Guernsey. The true cost should be considered in both in monetary terms and carbon impact which are featured on the calculator.
These calculations are based on a number of assumptions and should be used as a guideline only.
-
![]() Why charge between 11pm and 5am?Off-Peak Usage
Why charge between 11pm and 5am?Off-Peak UsageWhy charge an EV between 11pm and 5am?
Set the electric vehicle's on-board timer to charge between 11pm and 5am as this is the cheapest* and cleanest time to use electricity.
Even during the colder, darker months, the power station is not needed to top up demand between 11pm and 5am. This means the carbon footprint of EV drivers can be significantly reduced simply by changing when the vehicle is charged.
*Cheaper for customers on the Super Economy 12 Tariff
-
![]() Vehicle Study Definitions
Vehicle Study DefinitionsVehicle Lifetime
184,000 km was assumed as an average lifetime usage of a car, based on estimates from literature available for the study.
Electricity Mix
This consists of diesel-generated electricity at the Vale power station, on-island community solar power and imported renewable energy.
Lifetime Intensity
These carbon calculations consider the emissions generated across the entire energy production chain.
The Guernsey Electricity's mix for the emissions intensity of GEL's electricity includes an assumption based on the proportion of electricity generated by each energy source (oil and renewable imports).
*References: GEL sought independent advice from UK Carbon Emissions Specialists, WSP, in identifying the IPCC figures used in this note.

What stages were used in the vehicle study?
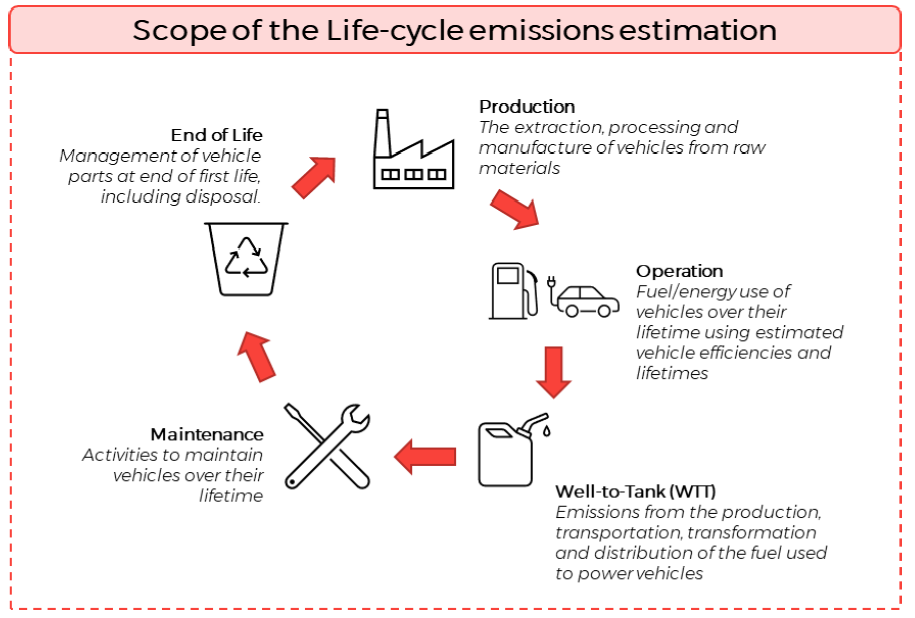
Production
Emissions generated during the production of all 3 types of vehicle. This includes producing the lithium-ion battery, together with raw material extraction and processing.
Operation
This includes exhaust pipe emissions from the combustion of petrol/diesel, emissions produced from generating electricity*, vehicle maintenance and well-to-tank (WTT) emissions.
*this includes electricity generated at the Vale power station. Electricity in Guernsey is made up of around 90% imported low-carbon energy – a mix of solar, wind and hydro power – with the remaining demand topped up by electricity from the power station.
Well-to-tank (WTT)
WTT specifically refers to the journey of the fuel used in the vehicle, from extraction (well) to final use in the petrol or diesel vehicle (tank).
Our study used data taken from a scientific publication which reviewed and consolidated the results from many lifecycle emission assessments on different vehicle types.
Maintenance
The carbons emissions generated from maintenance work to keep the vehicle in good working order.
End-of-life
This is when the vehicle, its part and components become waste and needs to be dismantled and disposed of.
This EOL figure is an average of several studies which also take into account battery recycling aspects.

As the battery reclaim process develops, and when there is a stable supply of used batteries to reclaim, it is likely that the End-of-Life (EOL) impact of electric vehicles will significantly decrease in the coming years and further reduce the full lifecycle impacts of electric vehicles.
EOL emissions were discerned from the review paper Review and Meta-Analysis of EVs: Embodied Emissions and Environmental Breakeven (Dillman et al 2020). The review highlights inconsistency in data regarding emissions from the end-of-life stage and battery replacement; it asserted that this was because of a lack of available data on recycling technologies and their success as EVs have only relatively recently entered the mass market and many are yet to reach end of life. The EV EOL emissions factor is the mean average of the meta-analysis of a range of EV lifecycle assessments, of which a few of these studies included recycling aspects.
Advertising campaigns
-
![]() Work it 9 to 5Verification Letter
Work it 9 to 5Verification LetterThis is an advertising campaign run by our sub-brand Electric Living to encourage electricity customers to consider switching some of their electricity usage to between 9pm and 5am while the power station is still being used during early 2022.
Frequently asked questions
We've answered some of the questions asked about electricity in Guernsey
We need to have a secure supply and local renewables alone cannot provide the electricity we need today, let alone in the future. Using a mix of sources will offer reliability and security for a sustainable supply.
Importing electricity today is the bridge to tomorrow's technology and will enable more local renewables. A second cable also opens up the opportunity to sell electricity to Europe.
This is becoming commercially viable, but at the moment it is not affordable for the island. The potential for exploiting Guernsey’s tidal range was investigated at Cobo Bay, Havelet Bay, Victoria and Beaucette marinas but the outputs and generation were initially too small to justify further investigation.
The import cable alone does not meet the islands electricity needs when energy demand is at its greatest. The GJ1 cable can provide 100% of Guernsey’s energy needs in summer and around 75% in winter, so the power station is still required as both a top-up for the winter peak periods and as a back-up when the GJ1 interconnector requires to be switched off for maintenance.
Guernsey Electricity’s long-term strategy is for an energy system that supports renewables and reduces the reliance on fossil fuels to use the power station for emergency generation only.
This second cable would mean that the power station will no longer need to ‘top-up’ supplies and will act purely as a ‘back-up’ for emergencies.